Deep Reinforcement Learning for Portfolio Allocation
Reproducing J.P. Morgan AI research to compare PPO against classical mean-variance optimization under market volatility.
Out-of-sample on ten S&P 500 sector portfolios, one held-out year at a time (2012–2021). PPO is a five-seed average for that year’s window. MVO is max-Sharpe with Ledoit–Wolf covariance. PPO matches MVO on Sharpe (0.96 vs 0.94) with lower volatility (9.8% vs 14.7%) and a much smaller worst drawdown (−15.4% vs −36.3%). MVO’s average annual return is higher (10.2% vs 8.5%).
Ten-year summary
Summary averages the ten yearly statistics. Max drawdown is the worst year (2020 for both). Calmar is the mean of yearly Calmar ratios. Turnover is mean absolute change in sector weights (cash ignored).
| PPO | MVO | |
|---|---|---|
| Average annual return | 8.5% | 10.2% |
| Average Sharpe ratio | 0.96 | 0.94 |
| Average annual volatility | 9.8% | 14.7% |
| Worst max drawdown | −15.4% | −36.3% |
| Average yearly Calmar ratio | 2.08 | 1.76 |
| Average daily turnover (Δp_w) | 0.68 | 0.29 |
By test year
PPO has the higher Sharpe in 2014, 2015, 2019, 2020, and 2021. In 2020 PPO stayed positive (+3.9%, drawdown −15.4%) while MVO lost 2.5% and drew down 36.3%.
| Year | PPO return | MVO return | PPO Sharpe | MVO Sharpe | PPO max DD | MVO max DD |
|---|---|---|---|---|---|---|
| 2012 | 0.9% | 5.3% | 0.15 | 0.53 | −6.4% | −10.1% |
| 2013 | 3.5% | 23.3% | 0.51 | 1.89 | −7.2% | −7.8% |
| 2014 | 13.6% | 12.2% | 2.12 | 1.07 | −3.4% | −7.7% |
| 2015 | 0.6% | 0.4% | 0.11 | 0.10 | −8.1% | −12.4% |
| 2016 | 9.5% | 20.1% | 1.05 | 1.33 | −8.9% | −8.5% |
| 2017 | 6.7% | 14.5% | 1.33 | 2.05 | −1.9% | −2.9% |
| 2018 | −6.8% | −11.6% | −0.82 | −0.72 | −7.4% | −18.9% |
| 2019 | 15.5% | 18.6% | 1.79 | 1.68 | −5.3% | −5.9% |
| 2020 | 3.9% | −2.5% | 0.28 | 0.11 | −15.4% | −36.3% |
| 2021 | 37.7% | 21.2% | 3.12 | 1.36 | −4.1% | −8.0% |
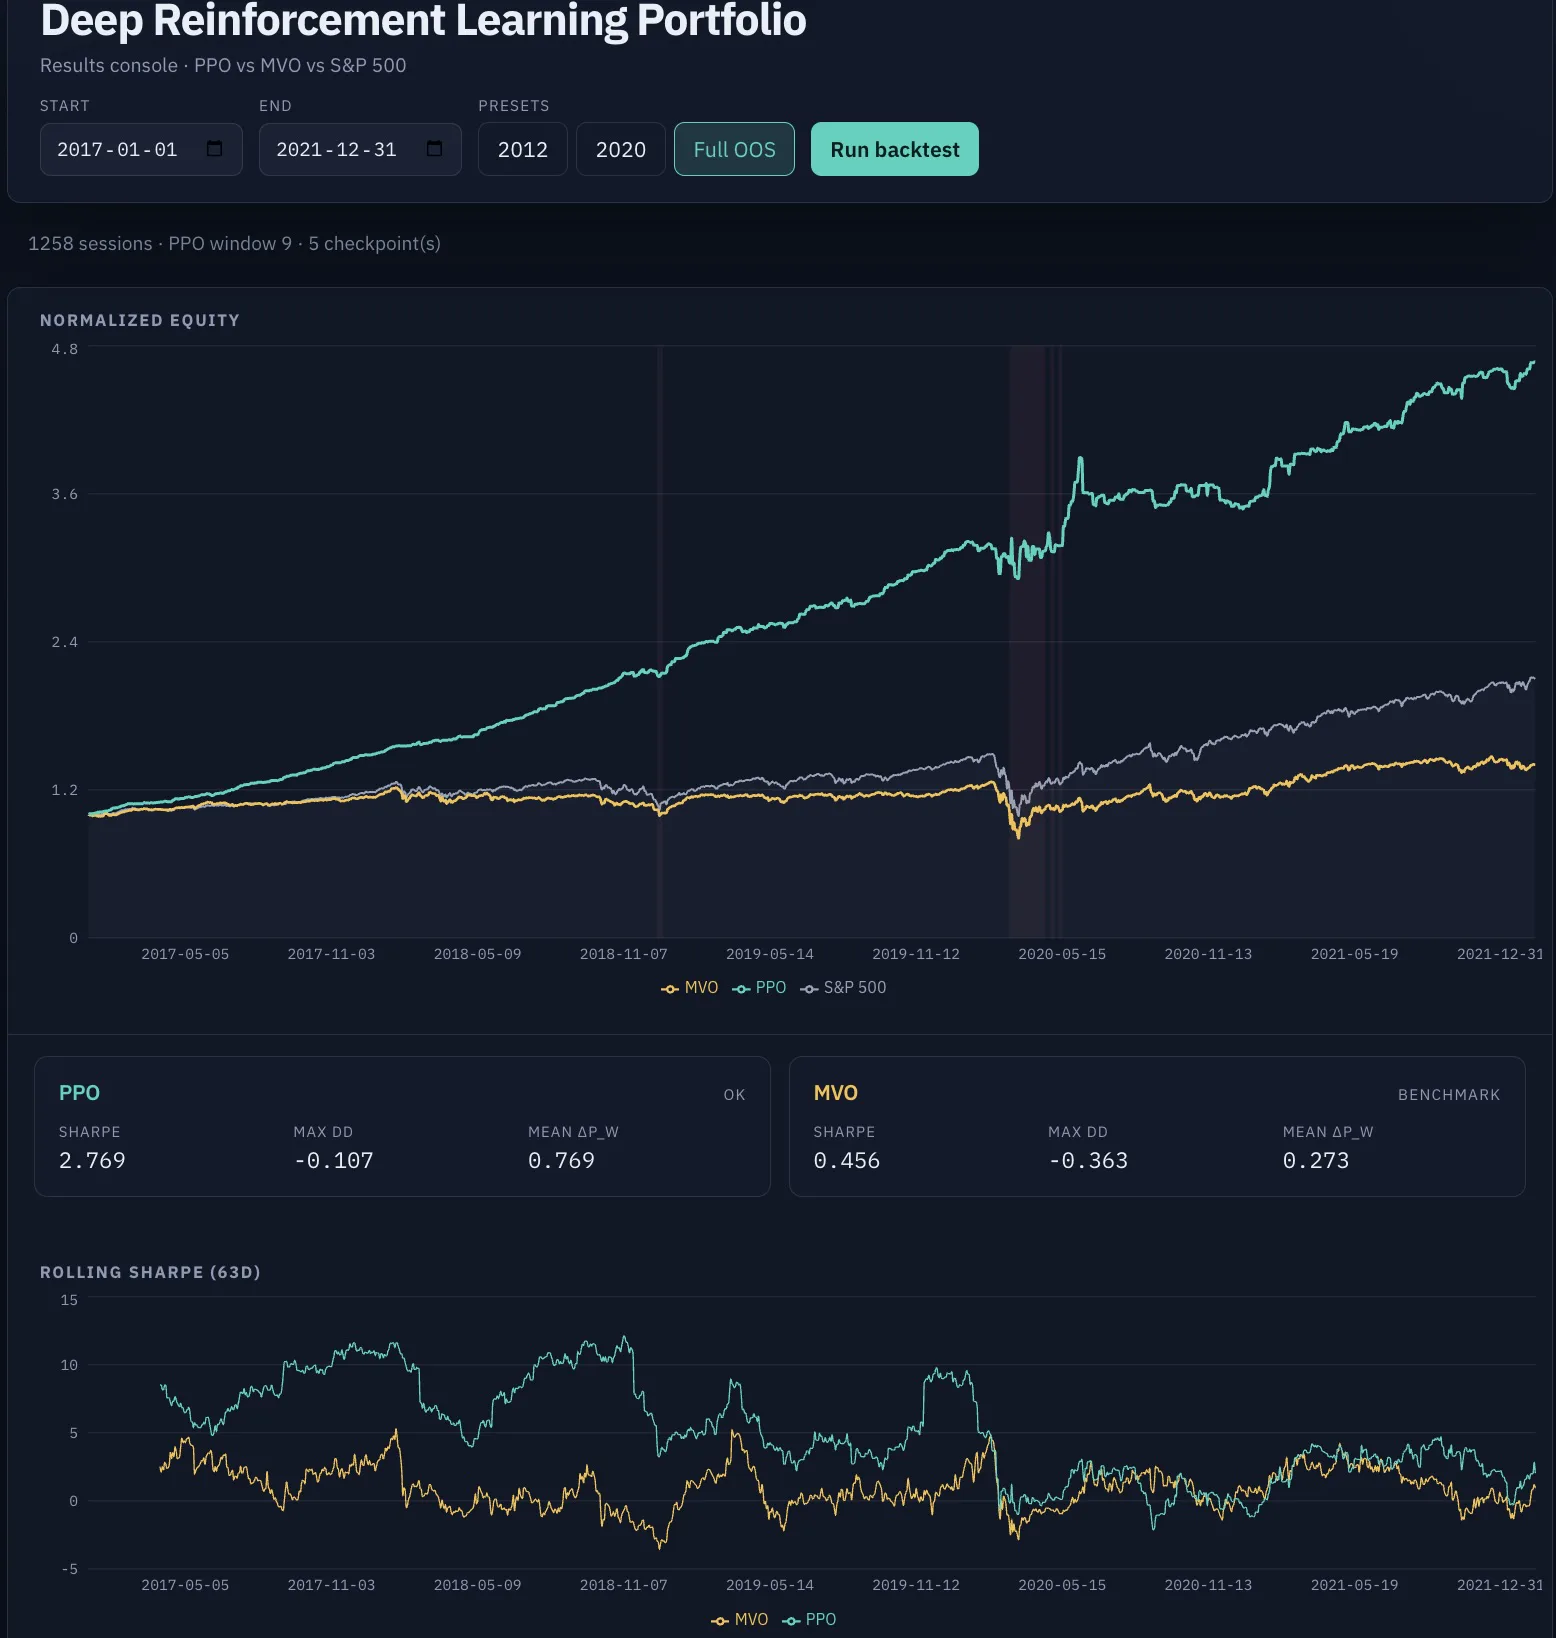
Full OOS equity
2017–2021 results console: normalized equity for PPO vs MVO vs S&P 500, summary cards, and 63-day rolling Sharpe.
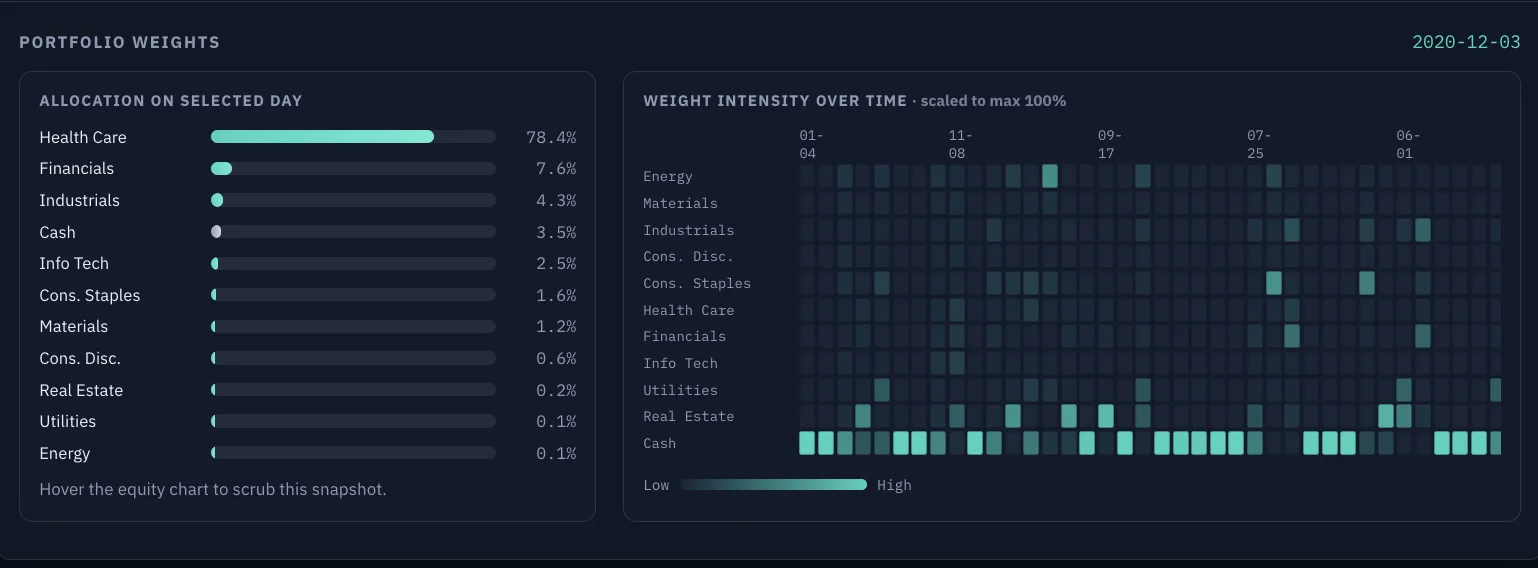
Full OOS weights
Sector allocation on a selected day and weight intensity over the full out-of-sample window.
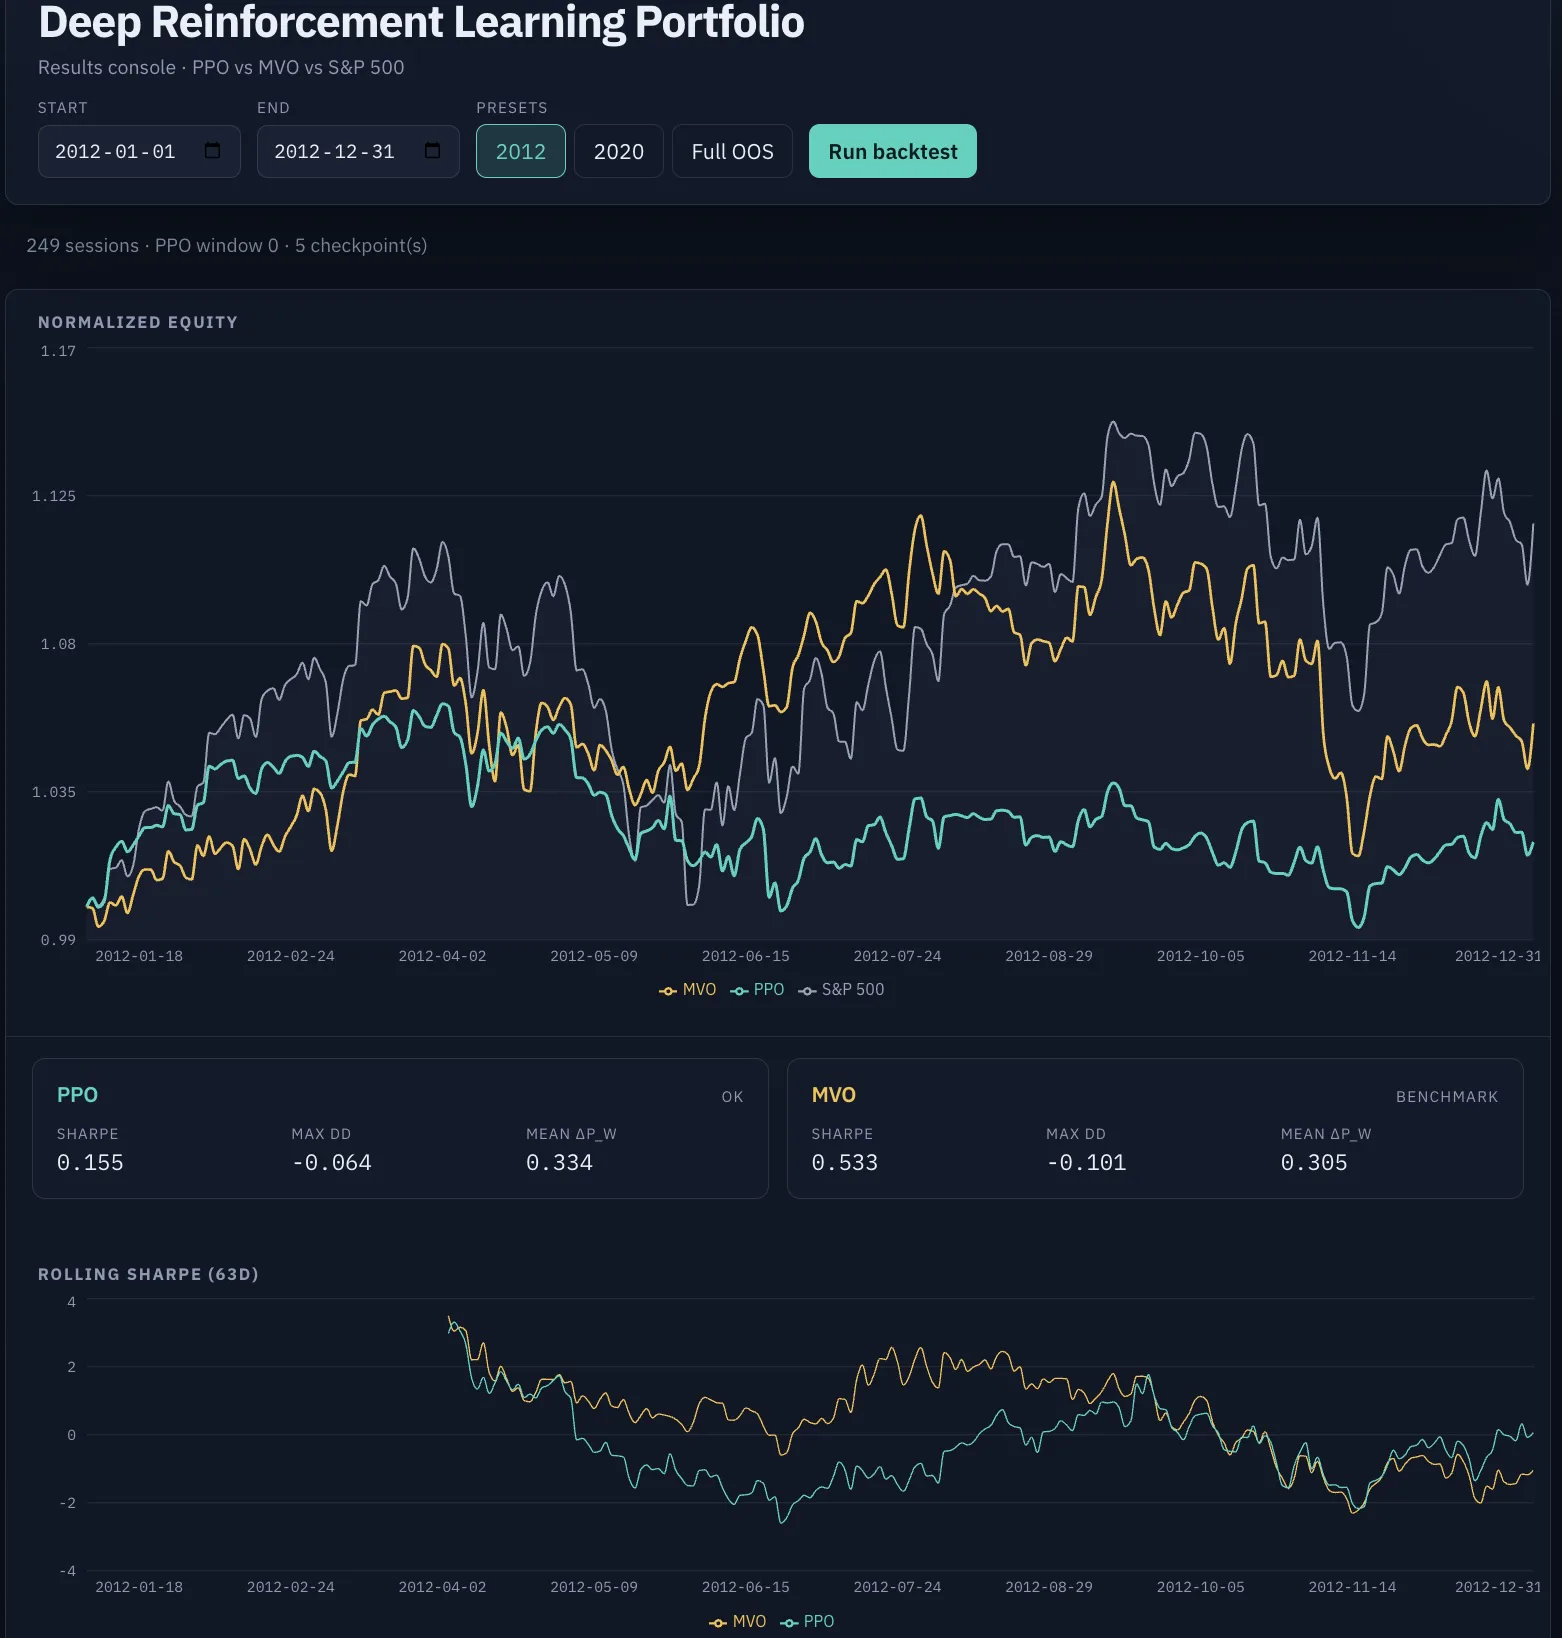
2012 equity
Single-year preset for 2012: normalized equity, PPO and MVO cards, and rolling Sharpe.
2012 weights
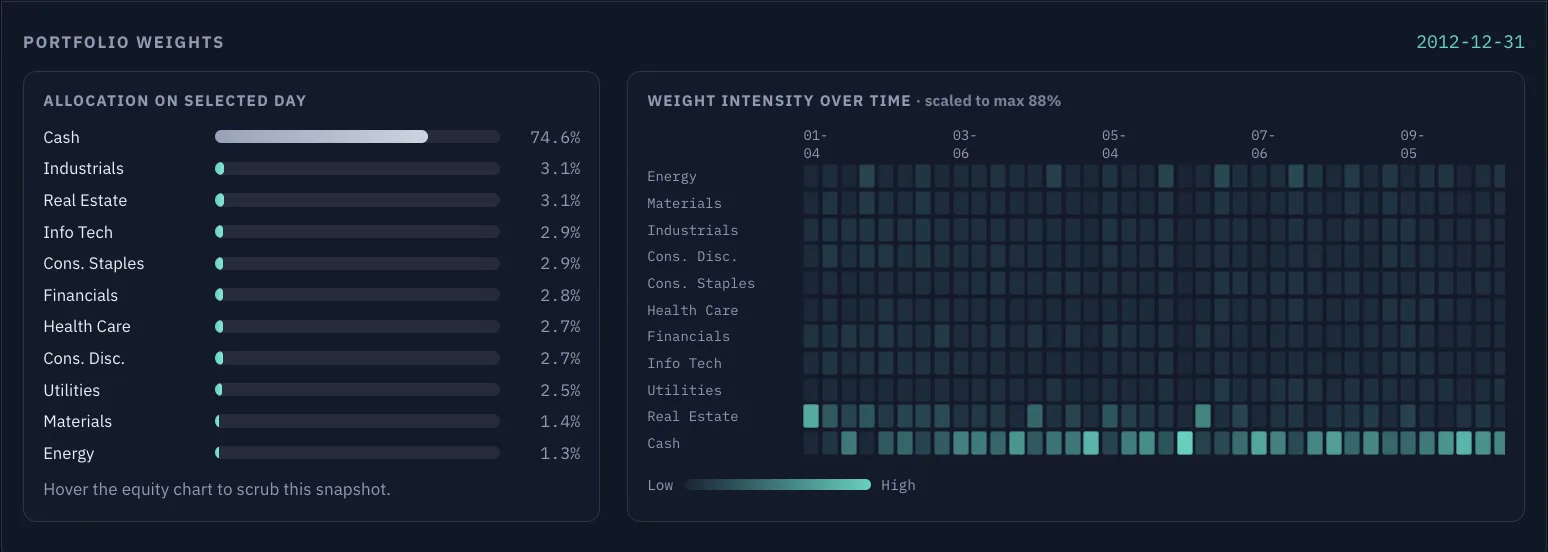
2012 allocation snapshot and weight intensity heatmap across the year.